Posted by: Mauro 5 years, 2 months ago

With an MQTT/Node-RED/InfluxDB/Grafana stack already in place on a cloud VPS, it's quite natural to be eager to monitor one more quantity. And since home internet traffic was missing from the measured dimensions, I decided it was time to attack the problem.
For sure - I thought - my FRITZ!Box 7530 must support SNMP… well, not at all!
Instead, it implements TR-064 "LAN-Side CPE Configuration" from the Broadband Forum, which uses UPnP as described here: TR-064: First Steps (AVM)
Fortunately, there are python modules ready for the job, within the fritzconnection project (thanks to Klaus Bremer). I came across fritzconnection through something very close to what I was about to do: FritzBox-monitor (thanks to Sebastian Werner).
In addition, I was looking for an excuse to test-drive Redis, out of pure curiosity. How could Redis have a role? (Redis is an in-memory DB, primarily used as a fast cache - and as an inter-process communication means - by a very large number of projects)
When you read the router status, it reports the number of bytes sent and received until then, while you usually want to know the rate in bits per second.
Therefore, the plan was writing a simple python script, which would:
- get the router status using fritzconnection,
- check for the presence of a previous status stored by Redis,
- calculate the difference between current and previous values,
- output a json representation of the status with the deltas,
- use Redis to store current status and exit.
In this way, subsequent runs of the script are independent, and it is possible to always get meaningful values, even when invoking the script at irregular intervals (the status is time-stamped). Also, testing the script becomes easier!
In production, it will be sufficient to commit the script to the care of cron, so that it gets run every minute.
(Of course, another approach would be to let Grafana do the deltas and graph them, but then there would be no place for Redis! :-))
The complete python script, fritzbwmon.py, is at the end of this post.
Development pc setup
In order to test fritzconnection and start developing the python script, it's best to create a virtual enviroment (venv), so that you can locally install python packages with pip, without impacting your system-wide configuration.
$ python3 -m venv venv
$ cd venv
$ source bin/activate
(venv) $ pip install fritzconnection
…
Successfully installed certifi-2020.12.5 chardet-4.0.0 fritzconnection-1.4.1 idna-2.10 requests-2.25.1 urllib3-1.26.3

(venv) $ pip install redis
…
Successfully installed redis-3.5.3
At this point, if there's a Fritz!Box running on the LAN, you can play with fritzbwmon.py
An item I wanted to address was also packaging, i.e. having a straightforward way to move the python script and its dependencies from the development laptop to the "production server" (a Raspberry Pi 3).
Here the python ecosystem offers a few options. I went for pex.
(venv) $ pip install pex
…
Successfully installed pex-2.1.30

(venv) $ pip freeze >requirements.txt
Now - and it can maybe depend on the GNU/Linux distro you're using - there is one too many entries in requirements.txt
(venv) $ cat requirements.txt
certifi==2020.12.5
chardet==4.0.0
fritzconnection==1.4.1
idna==2.10
pex==2.1.30
pkg-resources==0.0.0
redis==3.5.3
requests==2.25.1
urllib3==1.26.3
The line pkg-resources==0.0.0 needs to be deleted.
A setup.py must also be present:
from setuptools import setup

setup (
  name='fritzbwmon',
  version='0.1',
  py_modules=['fritzbwmon'],
  entry_points={
    'console_scripts': [
      'fritzbwmon=fritzbwmon:main',
      ]
    },
  )
Finally you can invoke pex:
(venv) $ pex -r requirements.txt -o fritzbwmon.pex . -e fritzbwmon:main --validate-entry-point
The above pex command should generate a working, self contained, python executable fritzbwmon.pex, which does not need the virtual environment to run.
(venv) $ deactivate
$ ./fritzbwmon.pex
fritzbwmon.pex can now be copied to the Raspberry Pi.
Raspberry Pi setup
On the Pi, before trying to run the pex file, we need to ensure Redis is installed:
$ sudo apt install redis
Then, to be able to send our readings to the mqtt server, an mqtt client must be installed:
$ sudo apt install mosquitto-clients
Sending an mqtt message with fritzbwmon output as payload can be achieved by a trivial shell script (in this case, using mqtt over ssl):
$ cat fritz-mqtt-pub.sh
#!/bin/bash

FRITZJSON=$(/home/pi/fritzbwmon.pex)

mosquitto_pub -h <mqtt_server> -t "fritzbox" -m "$FRITZJSON" -p 8883 \
 -u "<mqtt_user>" -P "<mqtt_password>" --capath /etc/ssl/certs/
One final thing needs to be done on the Pi: configure cron to run the script every minute.
$ cat /etc/cron.d/fritz-mqtt-pub
# run every minute to send mqtt msg with local router telemetry
* * * * * pi /home/pi/fritz-mqtt-pub.sh
Server setup
On the VPS, mosquitto-server, Node-RED, InfluxDB and Grafana are already running.
First, a new flow needs to be created in Node-RED, catching the mqtt messages with an mqtt input node, and injecting the relevant json attributes in InfluxDB.
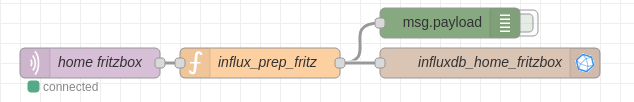
The selection of the json attributes to be passed over to the time-series DB is performed by a generic function node (influx_prep_fritz).
a = JSON.parse(msg.payload);
od = {
  up_kbps: a.up_kbps,
  dn_kbps: a.dn_kbps,
  active_hosts_count: a.active_hosts_count
};
msg.payload = od;
return msg;
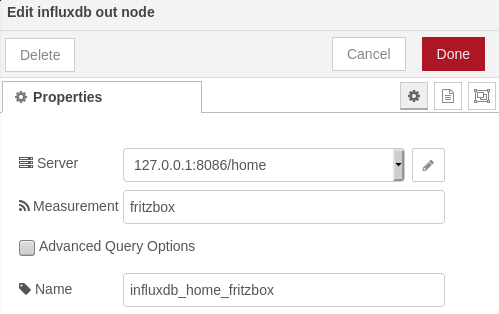
The influxdb out node properties look like this:
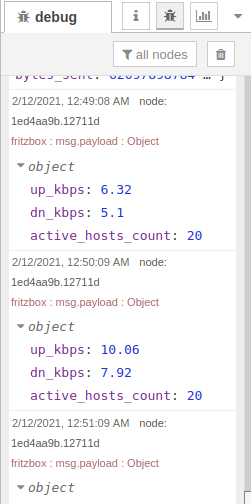
Activating the debug node, you can visualize incoming message payloads (after the filtering by the function node):
From the command line, you can also query influxdb directly, to verify that new records were inserted:
$ influx
Connected to http://localhost:8086 version 1.7.8
InfluxDB shell version: 1.7.8
> USE home
Using database home
> SELECT * FROM fritzbox
name: fritzbox
time                active_hosts_count dn_kbps up_kbps
----                ------------------ ------- -------
1613087408952849564 20                 7.92    10.06
1613087469044417556 21                 8.51     8.19
1613087528306218416 21                 7.06    11.5
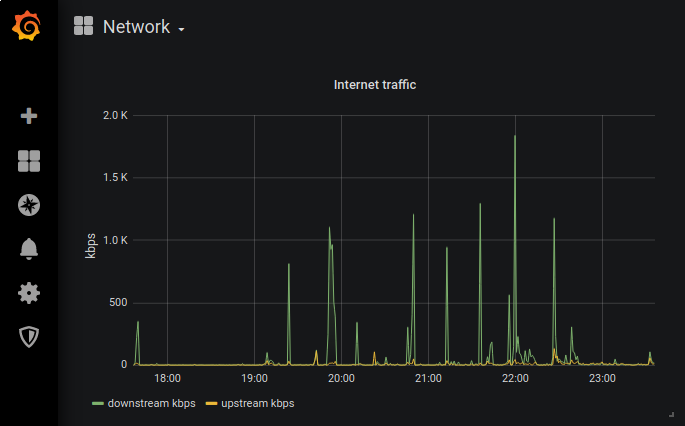
Finally, it's time to visualize data in a beautiful graph using Grafana!
fritzbwmon.py
"""
Adapted from fritzstatus.py and fritzhosts.py, part of fritzconnection
by Klaus Bremer
https://github.com/kbr/fritzconnection
License: MIT (https://opensource.org/licenses/MIT)

This script uses redis to store data from a previous script run.
It is then possible to highlight variations and to calculate
differences over time (e.g. traffic bandwidth usage)
"""

from fritzconnection.core.exceptions import FritzServiceError, FritzActionError
from fritzconnection.lib.fritzstatus import FritzStatus
from fritzconnection.cli.utils import get_cli_arguments, get_instance, print_header
from fritzconnection.lib.fritzhosts import FritzHosts
import redis
import time
import json

def redis_set_time(r, t):
    r.set('fritz_time', t)

def get_status(fs):
    attrs = ("is_linked", "is_connected", "external_ip", "str_uptime", "bytes_sent",
             "bytes_received", "str_max_bit_rate")
    # skipped: external_ipv6, ipv6_prefix
    fsd = {}
    for a in attrs:
        try:
            fsd[a] = getattr(fs, a)
        except (FritzServiceError, FritzActionError):
            fsd[a] = f'unsupported or error retrieving "{a}"'
    try:
        s = fsd["str_max_bit_rate"]
        if s[0].endswith(" MBit/s") and s[1].endswith(" MBit/s"):
            up_max = (s[0].partition(" "))[0]
            dn_max = (s[1].partition(" "))[0]
            fsd.pop("str_max_bit_rate")
            fsd["up_max_mbps"] = round(float(up_max), 1)
            fsd["dn_max_mbps"] = round(float(dn_max), 1)
    except:
        print("error while processing str_max_bit_rate attr")
    return fsd

def print_status(fsd):
    print("FritzStatus:\n")
    for k in fsd.keys():
        print(f" {k:22}: {fsd[k]}")
    print()

def redis_set_status(r, fsd):
    for k in fsd.keys():
        r.hset('fritz_status', k, str(fsd[k]))

def delta_status(r, tnow, fsd):
    dsd = {}
    if r.exists('fritz_time'):
        tpre = r.get('fritz_time')
        tdiff = tnow - float(tpre)
        if tdiff > 0:
            up_diff = fsd['bytes_sent'] - int(r.hget('fritz_status', 'bytes_sent'))
            dn_diff = fsd['bytes_received'] - int(r.hget('fritz_status', 'bytes_received'))
            # print(f" Elapsed time: {tdiff:6.2f} sec")
            dsd["elapsed"] = round(tdiff, 2)
            # print(f" UP: {up_diff} B - DOWN: {dn_diff} B")
            dsd["up_volume"] = up_diff
            dsd["dn_volume"] = dn_diff
            dsd["up_kbps"] = round((up_diff / tdiff) * 0.008, 2)
            dsd["dn_kbps"] = round((dn_diff / tdiff) * 0.008, 2)
            # print(f" UP: {up_kbps:6.2f} kbps - DOWN: {dn_kbps:6.2f} kbps")
    return dsd

def get_hosts(fh):
    hosts = fh.get_hosts_info()
    return hosts

def print_hosts(hosts):
    print('FritzHosts:')
    print(f'List of registered hosts: (total {host_count:>3})\n')
    print('{:>3}: {:<16} {:<28} {:<17} {}\n'.format(
          'n', 'ip', 'name', 'mac', 'status'))
    hosts = fh.get_hosts_info()
    active_count = 0
    host_count = 0
    for index, host in enumerate(hosts, start=1):
        status = 'active' if host['status'] else '-'
        active_count += 1 if host['status'] else 0
        host_count += 1
        ip = host['ip'] if host['ip'] else '-'
        mac = host['mac'] if host['mac'] else '-'
        hn = host['name']
        print(f'{index:>3}: {ip:<16} {hn:<28} {mac:<17} {status}')
    print('\n')
    print(f'Active / Total host count: {active_count} / {host_count}\n')

def redis_set_hosts(r, hosts):
    if r.exists('fritz_hosts'):
        r.delete('fritz_hosts')
    for h in hosts: # iterate over hosts list
        if h['status']: # consider active hosts only
            r.hset('fritz_hosts', h['mac'], f"('{h['ip']}','{h['name']}')")

def delta_hosts(r, hosts):
    active_count = 0
    hnew = {}
    hmiss = {}
    rh = {}
    if r.exists('fritz_hosts'):
        rhbstr = r.hgetall('fritz_hosts')
        for hbstr in rhbstr.keys(): # convert byte-strings to unicode
            rh[hbstr.decode()] = rhbstr[hbstr].decode()

        for h in hosts:
            if h['status']:
                active_count += 1
                if h['mac'] in rh:
                    # print(f" === {h['mac']}")
                    rh.pop(h['mac'])
                else:
                    # print(f" +++ {h['mac']}")
                    hnew[h['mac']] = (h['ip'], h['name'])
        for missing_mac in rh.keys():
            hmiss[missing_mac] = eval(rh[missing_mac])
            # print(f" --- {missing_mac}")
        # print(f" Active hosts count: {active_count}")
        return { 'active_hosts_count': active_count, 'new_hosts': hnew, 'missing_hosts': hmiss }
    else:
        return {}


def main():
    args = get_cli_arguments()
    args.password = 'dummy' # this is probably a bug: any password will do.
    args.address = '192.168.1.1'
    if not args.password:
        print("Exit: password required.")
    else:
        fs = get_instance(FritzStatus, args)
        fh = get_instance(FritzHosts, args)
        r = redis.Redis()
        tnow = time.clock_gettime(time.CLOCK_MONOTONIC)
        # print_header(fs)
        fsd = get_status(fs)
        # print_status(fsd)
        # print_hosts(fh)
        hosts = get_hosts(fh)
        dsd = delta_status(r, tnow, fsd)
        dhd = delta_hosts(r, hosts)
        redis_set_time(r, tnow)
        redis_set_status(r, fsd)
        redis_set_hosts(r, hosts)
        fsd.update(dsd)
        fsd.update(dhd)
        json_out = json.dumps(fsd)
        print(json_out)
        # json_out_pp = json.dumps(fsd, indent=2)
        # print(json_out_pp)
        # print(f"json str len: {len(json_out_pp)}")


if __name__ == "__main__":
 main()
Share on Twitter Share on Facebook
Recent Posts
- harman/kardon HK 620 no speaker output
- Volvo XC60 cannot play (some) MP3 tracks
- Solarmax Inverters Data to MQTT
- Monitor your FRITZ!Box Internet bandwidth usage using lots of free software: Python, Redis, Raspbian, Mosquitto, Node-RED, InfluxDB, Grafana
- IoT garden irrigation for less than 30€
Archive
2021
2020
- October (1)
2019
- April (1)
2018
Categories
- arduino (4)
- IoT (6)
- open hardware (1)
- open source (4)
- networking (2)
- Cisco (1)
- audio (1)
Tags
- openenergymonitor grafana influxdb nodered mqtt mosquitto arduino esp8266 (1)
- grafana influxdb nodered mqtt mosquitto (1)
Authors
- Mauro (10)
Comments
Comment awaiting approval 4 years, 5 months ago
New Comment